Credit card delinquencies are higher than in 2019 because lenders took on more risk
After falling during the pandemic, the share of consumers with a delinquent credit card has increased rapidly since 2021 and is now higher than in 2019. While consumers with delinquencies clearly show signs of struggling, news reports have taken the rising delinquency rate as a sign that financial distress is becoming more widespread, suggesting underlying weakness in the U.S. economy. We show that rather than being a sign of broader distress, this increase in delinquencies is explained by a substantial increase in the riskiness of recently issued credit cards.
Delinquencies have been concentrated among credit cards originated in the last few years and we show these credits cards were much riskier than in previous years. Two factors explain this extra risk: First, lending standards loosened a bit in 2021 and 2022 judging by a decline in credit scores at origination. At the same time, pandemic aid and forced savings pushed average credit scores up sharply. Effectively, by not tightening significantly, lenders were originating cards much further down the risk spectrum. We show this shifting risk composition explains why delinquencies are higher than in 2019.
Delinquencies rose rapidly in 2022 and 2023, but the rate has slowed in 2024
Figure 1 shows the share of consumers who have at least one open card that is more than 30 days delinquent and more than 90 days delinquent using the CFPB’s Consumer Credit Information Panel.1 Delinquencies had been increasing from 2015 to 2019, but declined sharply in 2020 and 2021 as forced savings and pandemic aid improved the average American’s financial situation. In 2022 and 2023, credit card delinquencies rose rapidly and have only slowed their increase in 2024 following a more typical seasonal trend.
Figure 1: Credit card delinquencies
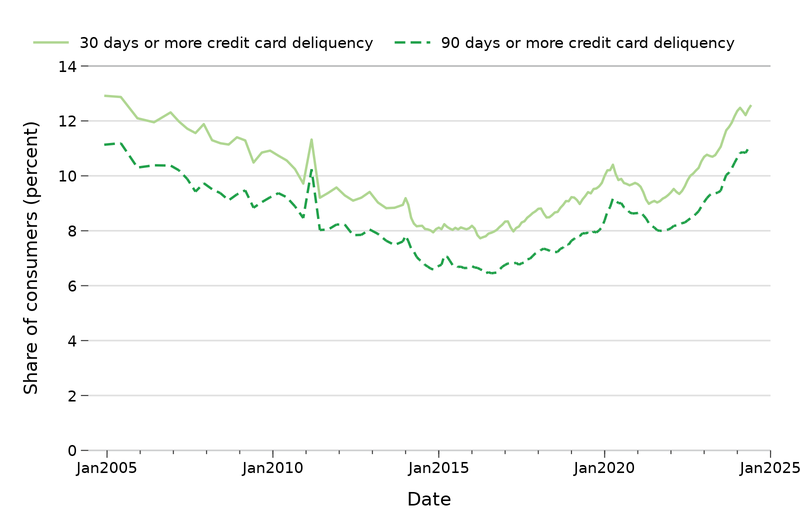
Source: Authors’ calculations from the CFPB Consumer Credit Information Panel. Data are quarterly prior to 2014 and monthly January 2014 and later.
Some of the increased delinquencies are likely just a return to pre-pandemic conditions. With many services shut down and substantial government aid, many people built up substantial savings during the first year of the pandemic. With more available savings there were fewer delinquencies , credit card balances fell, and the share of people revolving credit card debt declined . As the extra savings diminished and the economy returned to a similar state as in 2019, we might expect to also see delinquencies return to a similar level as in 2019. Yet delinquencies in 2024 are about two percentage points higher than in 2019. The higher delinquency rate has sparked much concern that perhaps there is widespread consumer distress underlying the rising delinquencies and that consumers may start reducing spending , leading to a general economic slowdown.
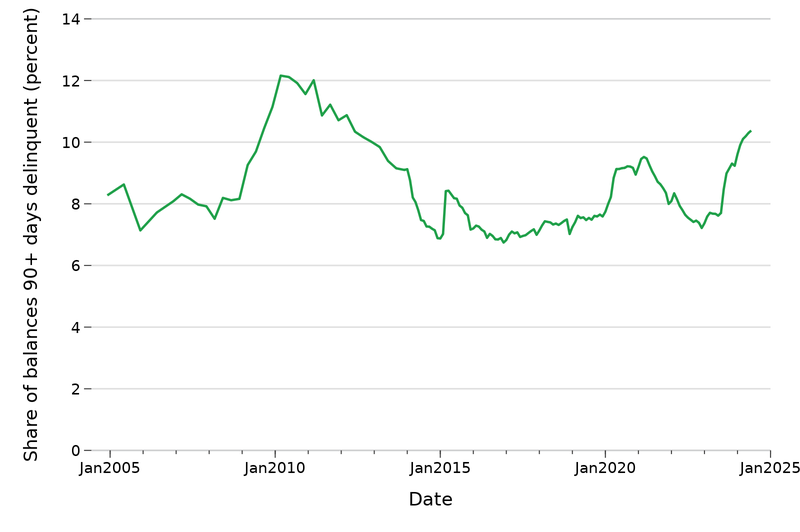
Adding to the confusion, publicly available data do not actually measure consumer delinquencies but the share of dollars delinquent. That is a useful measure of risk to financial institutions but is an imperfect measure of consumer distress. Yet much of the public discussion about rising delinquencies focuses on this measure. For comparison, we show the share of dollars delinquent using our definitions in Figure A-1 at the end of this post. Because consumers with higher limits, higher balances, and more cards are less likely to have a delinquency, consumer-level delinquencies are typically higher than dollar- or account-based delinquency rates.
Delinquencies fell for all age groups in 2020 and since then have been rising for all age groups as well. The rise in delinquencies has been most rapid among consumers aged 30-39 and 40-49. While delinquencies for consumers under 30 have been rising, they are only just at their 2019 level, having fallen even more sharply in 2020.
The loans originated in 2021, 2022, and 2023 went delinquent faster
Figure 2 shows credit card delinquencies by vintage. Vintage is a term used in the credit industry for credit cards originated in a particular period. Looking at vintages helps us understand whether the increase in delinquencies is widespread among all consumers or related to particular lending years by looking at the share of accounts opened each year that are past due. Figure 2 shows how severe delinquencies for each vintage from 2016 to 2023 changed by months since origination. For example, it shows that slightly less than 6 percent of the cards originated in 2016 were delinquent 24 months after they were issued to the consumer.
Figure 2: Credit card delinquencies since origination, by origination year
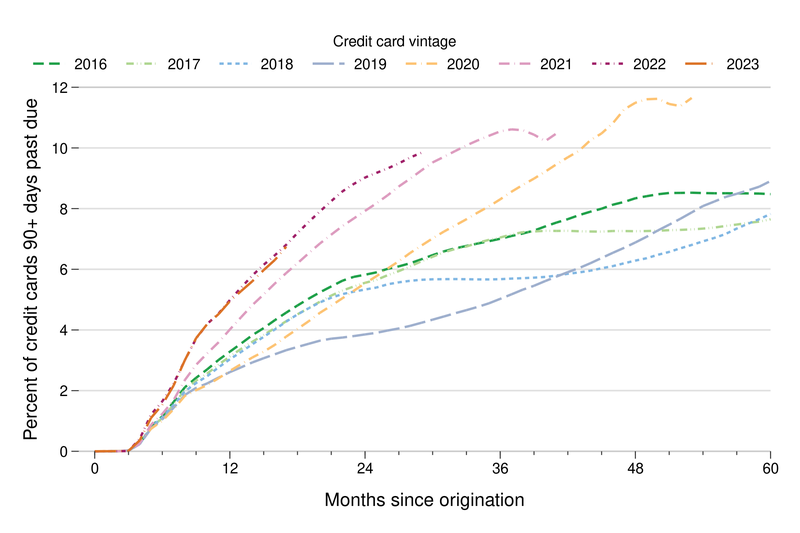
Source: Authors’ calculations from the CFPB Consumer Credit Information Panel.
Overall delinquencies increased rapidly over the last few years because the credit cards originated in 2021, 2022, and 2023 have gone delinquent much more rapidly than credit cards originated in other years. About 8 percent of credit cards originated in 2016 became delinquent about four years after origination. Meanwhile, the 2021 vintage reached an 8 percent delinquency rate just after 2 years while the 2022 vintage reached 8 percent after less than two years and 2023 has followed 2022 closely so far. (The 2020 vintage is in between the pre-pandemic and post-pandemic vintages reaching 8 percent delinquency after 3 years.) At the same time, credit cards originated in earlier years have not seen a similar increase in delinquencies in recent years.
For the vintages originated in 2020 or before, there is a sustained period in which delinquencies hardly increased which corresponds to the 2020 and early 2021 pandemic period when most Americans’ financial health improved across a range of measures . This flat period in each vintage corresponds to the sustained decline in overall delinquencies in Figure 1. After 2021, these vintages’ delinquencies started increasing again, contributing to the overall increase in Figure 1.
Cards originated in 2021 through 2023 were riskier than before
Figure 3 shows the credit score of new credit cards originated each month and the average credit score of all consumers on the left axis. During the Great Recession, lending standards tightened sharply, so that consumers with a new credit card had average scores above 720, even while the average credit score among all consumers was around 690. As a result, the average credit score rank for consumers with a new credit card was above 55 percent from 2008 to 2014, as shown on Figure 3’s right axis. A consumer’s credit score rank is what percentage of all consumers with a score have a score lower than that consumer.
Figure 3: Credit score and credit score rank for new credit cards at origination
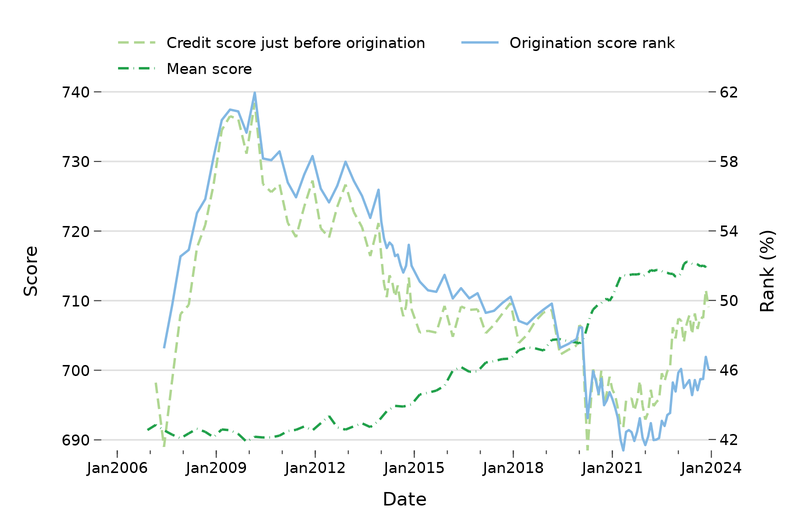
Source: Authors’ calculations from the CFPB Consumer Credit Information Panel. Data are quarterly prior to 2020 and monthly January 2020 and later. Score and score rank are calculated from the month or quarter before origination.
Compared to 2019, the average score just before origination fell by about 10 points in 2020 and fell again in 2021. Meanwhile, the average credit score among all consumers increased by 10 points as delinquencies fell rapidly and credit card utilization fell, pushing up scores. As a result, the origination score rank fell from around 50 between 2014 and 2019, to a low of 42 percent in 2021. Since then, rank and average score have increased somewhat, although the rank remains below its 2014-2019 average.
This decrease in origination score rank in 2021 and increase in late 2022 matches the loosening of credit standards for credit cards reported by banks in the Senior Loan Officer Opinion Survey (SLOOS) by the Federal Reserve in 2021 through the first half of 2022 followed by sustained tightening through 2023. However, score rank at origination also decreased in 2020 while the SLOOS reported tighter credit standards. That is, new credit cards were opened for borrowers who were relatively riskier despite lenders saying they were tightening standards in 2020. Because credit scores order borrowers by risk rather thanpredicting a specific level of risk , lenders who did not account for the change in score levels starting in 2020 may not have realized they were taking on more risk than the average credit scores at origination would suggest. It remains an open question whether lenders miscalculated their loosening in 2021 and 2022 as scores continued to rise but credit rank at origination did not or were intentionally seeking extra risk.
When we adjust for riskiness as measured by credit score just before origination, the 2021, 2022, and 2023 vintages have not gone delinquent any faster than previous vintages. Figure 4 shows delinquency re-weighted to hold credit riskiness the same for 2020-2023 as it was for 2016-2019. We took the share of all credit card originations in each 5-percentile score rank bin for 2016-2019 originations and then used those shares as the weights for the new origination when calculating delinquency rates. For example, 2.6 percent of credit card originations between 2016 and 2019 were made to consumers with a credit score rank between 10 and 14 percent, but this more than doubled to 5.8 percent for cards originated between 2020 and 2023. Because delinquencies are relatively high for cards in this score rank range, changing to the earlier score rank share puts less weight on this bin for later vintages when we reweight and lowers the rate of delinquencies.
Figure 4: Credit card delinquencies since origination adjusted for risk, by origination year
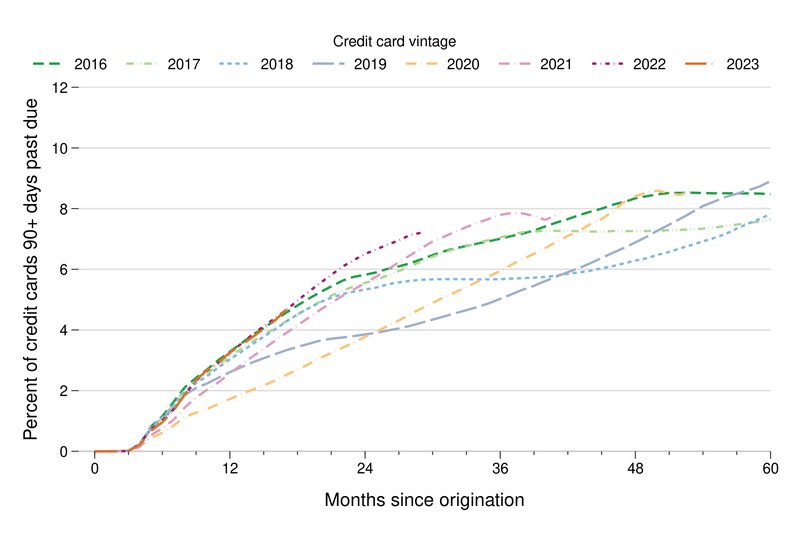
Source: Authors’ calculations from the CFPB Consumer Credit Information Panel.
Figure 4 shows a counterfactual in which the shares across the score rank distribution are held nearly the same in 2020-2023 as they were in 2016-2019. It does not assume that the consumers within each risk band are going delinquent faster or slower than they were before, but only adjusts for the substantially larger share of consumers at the bottom of the risk distribution in the later period.
Figure 4 shows that almost all of the increase in delinquencies in Figure 2 comes from this shift. It is difficult to discern the pre-pandemic and post-pandemic vintages because they lie nearly on top of each other. The only substantial differences occur during the pandemic slow down for each vintage. It is still possible that high inflation, the changing post-pandemic macro environment, rising real wages for lower-income consumers, and demographic distribution affect delinquencies, but these factors seem to mostly balance each other after adjusting for risk.
A shift in the risk distribution explains rising credit card delinquencies
Consumers with cash built up during the pandemic went delinquent much less frequently, pushing up average credit scores. Because lending standards did not tighten as measured by credit score at origination, effective lending standards loosened substantially. Once we adjust for how much riskier these loans are, these vintages are not going delinquent any faster than pre-pandemic vintages. Because rising delinquencies are explained by a compositional change, however, this increase is not necessarily evidence of more widespread consumer distress.
One consequence of the effective credit loosening is that more people with a higher risk profile opened new credit cards. On the other hand, as Figure 2 shows, a small but significant share of them went delinquent relatively soon after getting the card. Based on the Senior Loan Officer Survey, it seems that many lenders were not aware they were taking on additional risk and may not have expected the additional defaults; however, we cannot determine whether lenders intentionally took on all of this additional risk or not. The effects of this episode on consumers and lenders are still being felt. We will continue to monitor credit card and other delinquencies to ensure we are aware of any indications of growing consumer distress.
Figure A-1: Share of dollars delinquent
Source: Authors’ calculations from the CFPB Consumer Credit Information Panel.