Data Spotlight: Developments in the Paycheck Advance Market
Executive Summary
A significant driver of demand for consumer credit and financial products derives from the mismatch between when a family receives income and when a family must make payments for expenses. To reduce their costs, employers have a strong incentive to delay the payment of compensation to workers, which drives demand for short-term credit.
Credit cards, payday loans, and other financial products have long sought to address this credit need. In recent years, financial providers have developed new offerings in the marketplace, typically offered online. The CFPB has been analyzing the range of products that seek to provide funds to consumers in advance of receiving wages and compensation. While these advances have important similarities to payday loans and other products, they are also distinct from traditional offerings.
As part of the CFPB’s continued monitoring of the earned wage product market, we obtained data from eight providers to better understand the size of the market, usage patterns, and fee structures. This spotlight summarizes aggregated, anonymized data from that effort. All firms in our sample partner or integrate with employers’ payroll systems. We refer to this model as employer-partnered.1 Where available, we also include public data on direct-to-consumer earned wage products.2
A note on terminology: for clarity, this spotlight uses the phrase “earned wage product” to describe third-party products that tie funding amounts to accrued or estimated wages and that are repayable on the next payday or withheld from the next paycheck.3
Key Findings
- The market for employer-partnered earned wage products continues to grow rapidly. The CFPB estimates that the number of transactions processed by these providers grew by over 90% from 2021 to 2022, with more than 7 million workers accessing approximately $22 billion in 2022.
- The average transaction size is relatively small. Across providers in our sample of employer-partnered firms the average transaction amount ranged from $35 to $200, with an overall average transaction size of $106. The average worker accessed $3,000 in funds per year.
- Repeat usage is high and the share of workers using earned wage products each month is increasing. The average worker in our sample had 27 earned wage transactions per year. The share of workers in our sample using the product at least once a month increased from 41% in 2021 to nearly 50% in 2022.
- Few employers cover the cost of earned wage products on behalf of their workers. We estimate that employers in our sample subsidized less than 5% of total fees.
- When employers do not cover the cost, nearly all workers paid a fee for expedited access to their funds. Across our sample of surveyed companies, in 2021 and 2022, roughly 90% of workers paid at least one earned wage product-related fee. Among the companies in our sample that collect fees, the average cost per transaction ranged from $0.61 to $4.70. When workers paid a fee, the average size was approximately $3.18. Workers paid an average of $68.88 per year in fees.
- Based on the average data inputs in our sample, an illustrative annual percentage rate (APR) for a typical employer-partnered earned wage product transaction equates to 109.5%. As actual APRs will vary depending on transaction size, fees paid, and duration, this APR estimate understates APRs for smaller transactions with shorter terms.
Product Overview
In the US, nearly three-quarters of workers on non-farm payrolls are paid every two weeks or monthly.4 Managing liquidity can be particularly expensive for lower-income workers and options they may consider include payday loans, credit cards, overdraft, earned wage products, and missing payments on household bills and debt.5 Earned wage products provide workers access, before their payday, to a portion of their earned but unpaid wages or to funds that purport to equal or approximate a portion of their unpaid wages.
Earned wage products are offered through two primary models, the employer-partnered model and the direct-to-consumer model.
In the employer-partnered model, a third-party firm contracts with employers, typically provides the funding, integrates with the employer’s time and attendance records to determine actual wages that have been earned but not yet paid, and is repaid by payroll deduction. Employer-partnered firms have relatively low customer acquisition and marketing costs after the employer relationship is established, do not pull credit reports or credit scores, and typically have no access to the worker’s bank account for repayment. A frequently cited report from an industry analyst on the size of the U.S. employer-partnered earned wage product market estimated that in 2020, there were 56 million individual transactions amounting to $9.5 billion.6 This was three times the estimated size of the market in 2018, at $3.2 billion across 18.6 million transactions.
In the direct-to-consumer model, there is no employer integration or relationship, and the firm markets its services directly to the general public.7 Because direct-to-consumer firms do not typically have access to employers’ time and attendance records, they use alternate methods to estimate the amount of a consumers’ earned but unpaid wages at the time the consumer seeks access to funds. For example, direct-to-consumer firms typically require proof of or access to recent pay stubs or regular bank deposits and bank account transactions, and some direct-to-consumer firms utilize geolocation services to estimate hours worked.8 Repayment is typically made by directly debiting the consumer’s bank account, which could result in consumers paying overdraft or NSF fees if their accounts do not contain sufficient funds on the repayment date.
Anecdotally, most market observers agree that earned wage product transactions grew significantly over the last few years.9 This report updates the current sizing estimate of the earned wage products market and provides other data.
Data Collection Methodology
In 2023, the CFPB obtained data from eight employer-partnered earned wage product firms, constituting, by our estimates, slightly less than half of the overall employer-partnered earned wage product market. These firms provided data for 2021 and 2022 that included:
- Number of unique users
- Number of transactions
- Dollar amount of transactions
- Average number of transactions per user
- Average dollar amount of transactions
- Average length of time between transaction and scheduled due date
- Total dollar amount of fees paid
- Number of users who paid a fee, by category
- Number of users who paid no fee
- Number of times the amount collected was less than amount due (charge-offs)
- Number of unique users by transaction frequency
Results
This section features descriptive statistics from our data collection including market sizing, fees, usage patterns and charge-off rates. While our data comes from only employer-partnered earned wage product providers, when possible we use these results combined with other data to discuss both direct-to-consumer products and the overall earned wage product market.
Market size and growth
Across our sample from 2021 to 2022, both the number of employer-partnered earned wage product transactions and the total dollar amount of funds accessed nearly doubled. In aggregate, in 2021, the eight firms in our sample processed $4.57 billion in funds with 43 million transactions across 1.88 million unique users (see Figure 1). In 2022, this grew to $8.90 billion in funds and 83 million transactions across 2.80 million unique users. The number of unique users also increased, albeit at a slightly lower rate. These figures suggest that the employer-partnered earned wage product industry has continued to grow significantly since 2020. The difference between user growth and overall growth in transaction volume also suggests a substantial increase in the average frequency of use.
Adding publicly available data to the CFPB’s sample, we estimate that since 2020 the employer-partnered earned wage product market has nearly doubled in size. In 2022, employer-partnered earned wage firms advanced $22.8 billion across 214 million transactions.10 We further estimate that in 2022, 7.2 million workers utilized employer-partnered earned wage products at least once.
In addition, we estimate that direct-to-consumer earned wage product providers issued approximately $9.1 billion in funds for 3 million consumers. Combined with employer- partnered transactions, in 2022, roughly 10 million workers utilized earned wage product transactions to access over $31.9 billion.11
FIGURE 1: Employer-partnered earned wage product growth rate (2021-2022)
| Metric | 2021 | 2022 | Growth Rate |
|---|---|---|---|
Unique Users |
1.9M |
2.8M |
48.5% |
Number of Transactions |
43.2M |
83.4M |
93.2% |
Funds Advanced ($) |
$4.6B |
$8.9B |
94.7% |
Fees
Most employer-partnered earned wage product firms provide free and fee-based options for receipt of funds.
Free options typically include an ACH funds transfer to the worker’s external bank account that may take one-to-three days; instant receipt of funds on the provider’s debit, prepaid, or payroll card;12 visiting a specified retail store to obtain funds; taking the funds on a designated retailer’s gift card; or employer-subsidized funding of some or all of transfers. Marketing to employers often promotes the free or no cost options for workers.13
There are several fee-based options. Workers who want immediate access to funds in an account of their choice generally must pay an expedited payment fee. Some providers only offer one transfer method and charge a flat fee for all transactions. Others charge fees as a percentage of funds requested. Very occasionally, employer-partnered earned wage product providers have charged workers periodic subscription fees, though these are far more common in the direct-to-consumer space.14
Fee-based options among direct-to-consumer earned wage product companies include expedited payment fees, transaction fees, and periodic fees. In addition, some direct-to-consumer companies solicit “tips” from users. One recent data summary found that the average tip amount was $4.09, and that tip-based providers received such fees 73% of the time.15 Several reports have criticized the tip model.16 Employer-partnered earned wage product firms typically do not solicit or accept tips.17
Figure 2 includes a description of fees charged by a selection of both employer-partnered and direct-to-consumer providers obtained from publicly available websites.18 These providers are not necessarily representative of the industry or the firms that participated in the CFPB’s data collection.
FIGURE 2: Sample of earned wage product fee models19
| Company | Business Model | Fee Structure (Amount) |
|---|---|---|
AnyDay |
Employer-Partnered |
Overnight ACH fee ($1.50) and expedited transfer fee ($2.50) |
Branch |
Employer-Partnered |
Expedited transfer fee ($2.99-$4.99) |
DailyPay |
Employer-Partnered |
Expedited transfer fee ($3.49) |
Immediate |
Employer-Partnered |
Flat access fee ($3) |
OrbisPay |
Employer-Partnered |
Overnight (ACH) fee ($1) and expedited transfer fee ($2.95) |
Rain |
Employer-Partnered |
Expedited transfer fee (up to $5.99) |
Brigit |
Direct-to-Consumer |
Periodic fee ($8.99-$14.99 per month depending on plan selected; $14.99 plan includes expedited transfers) |
Dave |
Direct-to-Consumer |
Periodic fee ($1 per month), expedited transfer fee to an external bank account (5% of transaction with $5 minimum), and tips |
In our sample of employer-partnered firms that collect fees, user fees ranged from $1.99 to $5 per transaction. One firm offered a free suite of options, while two firms charged a flat fee for each transaction. The remaining firms provided a mix of pricing options. The most common fee in our sample was an expedited payment fee; 96.61% of all fees paid by workers across 2021 and 2022 were for expedited payments. Across 2021 and 2022, we estimate that the average amount workers paid for transactions with fees was $3.18 per transaction.20 When we include all transactions, including both free and with fees, the average cost to workers was $2.60 per transaction.
Some providers in our sample also reported that some employers subsidize their workers’ transactions, although by our calculations employer subsidization made up approximately 5% of total fee revenue.21 Unless otherwise stated, all fee metrics refer to data from our sample of nonsubsidized fees paid by users for employer-partnered earned wage product-related transactions.
Without employer subsidization, across both years in our sample, around 90% of workers paid at least one fee and approximately 82% of transactions incurred a fee.22 In these transactions, almost all consumer-paid fee revenue (96.6%) was derived from expedited transfer fees. Just 3.3% of fee revenue came from flat transaction fees, and 0.05% of fee revenue came from subscription fees.23
As a percentage of origination volume, user fees varied from under 1% to nearly 6% across the surveyed companies. These fees equaled approximately 2% of total origination volume, roughly translating to an overall cost of $2 per $100 accessed. Between 2021 and 2022, there was a slight increase in both total fees as a percentage of origination volume and overall share of workers who paid at least one fee although the total dollar amount of fees paid by workers more than doubled (see Figure 3).
FIGURE 3: Employer-partnered earned wage product fee breakdown24
| Metric | 2021 | 2022 |
|---|---|---|
Share of users who paid at least one fee |
89.5% |
91.3% |
Total fees paid |
$87M |
$180.3M |
Estimated % of transactions with fees |
82.6% |
82.5% |
Total user-paid fees (% of transaction volume) |
1.9% |
2.1% |
Annual Percentage Rate and Costs
For illustrative purposes and using average inputs from our sample data, a single earned wage product transaction of $106 with $3.18 in fees for a ten-day period (see Figure 5 below) equates to an APR of 109.5%. As actual APRs will vary depending on transaction size, fees paid, and duration, a 109.5% APR understates APRs for smaller transactions with shorter terms. For example, a $50 transaction with $3.18 in fees for four days equates to a 580.4% APR. This kind of APR variance may explain why studies with access to transaction level data report higher average APRs.25
Using published data from a direct-to-consumer firm, a $144 transaction for a seven-day period, with $8 in fees (the combined average tip and fee amount) equates to a 290% APR.26
Costs Over Time
Figure 4 describes the range of costs in our sample associated with different employer-partnered earned wage product pricing and usage patterns over time. The average cost workers paid per transaction varied widely across the companies in our sample, ranging from $0.61 to $4.70, with an average of $2.60. The figure below assumes that each transaction at a given firm costs the same amount. Average frequency of usage also varied significantly across firms, ranging from 10 yearly transactions to over 40, with an average of 27. Workers using the same earned wage product firm may also exhibit significantly differently usage patterns depending on their needs and preferences. Figure 4 illustrates costs based on hypothetical usage patterns ranging from 10-42 uses per year, even though actual patterns may fall outside of this range.
FIGURE 4: Sample employer-partnered earned wage product worker costs and usage patterns
| - | $0.61 Average Cost | $2.60 Average Cost | $4.70 Average Cost |
|---|---|---|---|
User A (10 transactions per year) |
- |
- |
- |
Cost per advance |
$0.61 |
$2.60 |
$4.70 |
Cost per month |
$0.51 |
$2.17 |
$3.92 |
Cost per year |
$6.10 |
$26.00 |
$47.00 |
User B (27 transactions per year) |
- |
- |
- |
Cost per advance |
$0.61 |
$2.60 |
$4.70 |
Cost per month |
$1.37 |
$5.85 |
$10.58 |
Cost per year |
$16.47 |
$70.20 |
$126.90 |
User C (42 transactions per year) |
- |
- |
- |
Cost per advance |
$0.61 |
$2.60 |
$4.70 |
Cost per month |
$2.14 |
$9.10 |
$16.45 |
Cost per year |
$25.62 |
$109.20 |
$197.40 |
Usage Patterns
In our sample, the average employer-partnered earned wage product transaction size ranged from $35 to $200, with an overall average transaction of $106. The average frequency with which workers used employer-partnered earned wage products also varied significantly across providers, ranging from less than once a month to more than 3 times per month. Generally, providers that reported lower average transaction amounts also reported higher usage. Average transaction size and frequency likely reflect variation in marketing and company policies. For example, some employer-partnered providers offer funds to workers based on the amount of pay earned on a daily basis, with offers expiring at the end of the work day or shift, whereas others limit transaction frequency to once or twice a week and provide access to the amount of all accumulated earnings.27 As such, in our sample the average amount of funds a worker accessed per year varied by employer-partnered company; ranging from under $700 to nearly $4,200. Across 2021 and 2022, workers took out an average of 27 transactions per year, equating to slightly more than two wage advances per month. See Figure 5 for average transaction size and other metrics.
FIGURE 5: employer-partnered earned wage product transaction size and volume
| Metric | 2021 | 2022 |
|---|---|---|
Average transaction size |
$105.94 |
$106.73 |
Average yearly transactions per user |
22.90 |
29.80 |
Average number of days between transaction and pay date |
10.21 |
10.51 |
A common usage trend across employer-partnered providers is a U-shaped frequency distribution curve. In our sample, for 2021 and 2022, more than half of workers used an employer-partnered earned wage product once a month or less while roughly one-quarter of workers were very frequent users, taking out more than two transactions per month (see Figure 6). As many workers receive pay on a bi-weekly basis, this indicates that a substantial portion of workers used the product at least once per pay period during the survey period.
FIGURE 6: Share of users of employer-partnered earned wage products by yearly transaction frequency
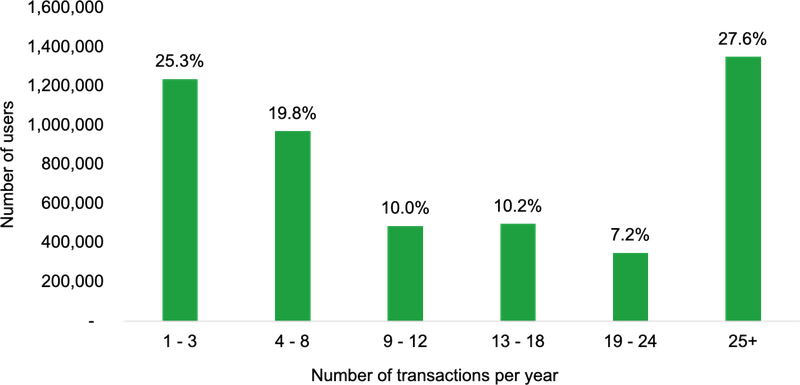
The share of workers utilizing employer-partnered earned wage products on a regular cadence (once a month or more) slightly increased from 2021 to 2022, from 40.5% to 47.9%.
Charge-offs
Employer-partnered earned wage product providers generally reported very low rates of uncollectible transactions. As described above, employer-partnered companies typically integrate with employers’ payroll systems and automatically deduct repayments from the worker’s next paycheck. In rare instances, employer-partnered providers may be unable to recover funds from a worker, although in our sample data this occurred in less than 1% of all transactions. For employer-partnered firms, the providers’ failure to recover funds may occur when a user terminates employment before a transaction can be recovered or incoming pay stubs are unexpectedly low. In the rare instances of nonpayment of employer-partnered earned wage product, the only consequence is typically loss of future access to the product.
Employer-partnered earned wage product charge-off rates are significantly lower than publicly available charge-off data for direct-to-consumer companies (see Figure 7). This difference in charge-off rates is likely due to differences in repayment methods. Because direct-to-consumer providers do not typically have access to employers’ payroll systems for repayment, they collect funds from workers’ bank accounts. In addition, they often must rely on users’ self-reported or estimated earnings when offering their products and may utilize contractual and legal remedies for non-payment.
FIGURE 7: Earned wage product charge-off rates28
| Metric | 2021 | 2022 |
|---|---|---|
Employer-Partnered charge-off rate |
0.3% |
0.3% |
Direct-to-Consumer sample charge-off rate |
6.5% |
6.3% |
Conclusion
Earned wage product use is increasing. Across the combined employer-partnered and direct-to-consumer earned wage product market, we estimate that in 2022, at least 5% of American workers utilized an earned wage product at least once. Our data indicates that employer-partnered earned wage product growth has accelerated throughout 2023.
Our data shows that despite firms marketing these services as free for workers, in non-employer subsidized transactions, most workers paid at least one fee and nearly all workers opt to pay a fee for expedited access to their funds. Based on average usage and cost patterns in our data, an illustrative APR is 109.5%. Although earned wage products are typically marketed as a free or low-cost solution for immediate short-term liquidity constraints, a high percentage of fee revenue comes from expedited transfer fees and repeat use. With nearly 50% of earned wage product users taking funds more than once a month, costs may accumulate for workers who are frequently paid by the hour, have liquidity constraints, and receive public benefits.29
There is also a risk that workers may become financially overextended if they simultaneously use multiple earned wage products. Although this is unlikely within the employer-partnered market, it is possible that workers could use multiple direct-to-consumer products or use them in combination with employer-partnered products.
Footnotes
-
Employers in the retail, travel, healthcare, call center, hospitality and fast-food markets commonly offer employer-partnered earned wage products; it is also prevalent among rideshare drivers. Publicly advertised employers offering earned wage products include Humana, PayPal, Walmart, American Airlines, Uber, Lyft, Door Dash, Kroger, Wendy’s, and Westgate Resorts. Partnering providers include fintech firms (see Figure 2 for a sample of some of these firms) and human resource, benefits, and payroll providers such as ADP, Ceridian, and Gusto. Employer-partnered earned wage products are sometimes referred to as business-to-business.
↩ -
Direct-to-consumer earned wage products are sometimes referred to as D2C or payday advance and may be integrated with a banking app. Note that this spotlight does not focus on payroll cards.
↩ -
These products are sometimes referred to as wage advance programs, small loans, earned wage access, earned wage advances, early wage access, on demand pay, and income-based advances. See https://files.consumerfinance.gov/f/documents/cfpb_comment-letter-to-dfpi-2023-11.pdf ; 12 CFR 1041.3(d)(7) at https://www.govinfo.gov/content/pkg/FR-2017-11-17/pdf/2017-21808.pdf ; https://dfpi.ca.gov/wp-content/uploads/sites/337/2023/11/PRO-01-21-1st-Modified-Text.pdf ; and Financial Health Network, Earned Wage Access and Direct-to-Consumer Advance Usage Trends (April 2021), https://cfsi-innovation-files-2018.s3.amazonaws.com/wp-content/uploads/2021/04/26190749/EWA_D2C_Advance-_sage_Trends_FINAL.pdf . The Financial Health Network is primarily funded by financial institutions.
↩ -
U.S. Bureau of Labor Statistics, Current Employment Statistics – CES (National) (February 2023), https://www.bls.gov/ces/publications/length-pay-period.htm .
↩ -
Herman Donner and Francis Daniel Siciliano, The Impact of Earned Wage Access on Household Liquidity and Financial Well-Being (January 2022), https://papers.ssrn.com/sol3/papers.cfm?abstract_id=4007632 (hereinafter Donner & Siciliano); Brookings Institution, Meet The Low-Wage Workforce (November 2019), https://www.brookings.edu/research/meet-the-low-wage-workforce .
↩ -
Leslie Parrish, Making Ends Meet: On-Demand Pay and Employer-Based Loans (February 2021), https://aite-novarica.com/report/making-ends-meet-demand-pay-and-employer-based-loans . This estimate was based on interviews with executives of earned wage product firms (hereinafter “Parrish 2021”).
↩ -
While employer-partnered firms integrate directly with a user’s payroll, some D2C firms are also able to do this via user-permissioned or user-shared time and attendance data. The majority of D2C firms still rely on an estimate of wages rather than real-time access. In addition, some D2C firms recoup funds from payroll deductions (“split deposits” similar to military allotments). See https://www.nytimes.com/2022/08/06/business/lenders-retailers-money-paycheck.html . There are other differences between the two models. See Marshall Lux and Cherie Chung, Earned Wage Access: An Innovation in Financial Inclusion? (Harvard Kennedy School Working Paper Series, No. 214) (June 2023), https://dash.harvard.edu/handle/1/37376263 (hereinafter “Lux & Chung”), pg. 14.
↩ -
Earnin, FAQ – GPS earnings, https://help.earnin.com/hc/en-us/articles/14055905380371-FAQ-GPS-earnings (last visited March 14, 2024).
↩ -
Lux & Chung pg. 2.
↩ -
Using public information on mobile application downloads, market monitoring with industry participants, and analysis of public financial information, we estimate that our sample of providers constitutes slightly less than half of the total employer-partnered market. This estimate does not necessarily include payroll or benefits companies that partner with employers to provide earned wage products in addition to other services. We also exclude employer-partnered providers for whom there are no reliable metrics on yearly users or transaction volume.
↩ -
Two large D2C companies, Dave and MoneyLion, combined for $4.5 billion in wage access volume in 2022. CFPB market monitoring and third-party analysis indicates these two companies constitute approximately half of the D2C market. See https://investors.moneylion.com/filings-financials/sec-filings/annual-reports/content/0000950170-23-008455/ml-20221231.htm ; https://investors.dave.com/node/8116/html ; and Parrish 2021, pg. 18-19.
↩ -
Earned wage product firms typically earn a percentage of interchange fee revenue from these cards. In addition, cards may carry usage fees such as out-of-network ATM withdrawal fees, balance inquiry fees, ATM decline fees, transfer to digital wallet fees, and express shipping for replacement card fees. See, e.g., Instant Financial, Payroll Card Cardholder Agreement, https://www.instant.co/cardholder-agreement/ ;Payactiv, Fee Schedule, https://www.payactiv.com/assets/pdf/card411/CS231164.PayactivPrepaid.LongForm.CBKC12042023.pdf ;and DailyPay, Cardholder Agreement, https://friday.dailypay.com/legal/card-agreement/ All websites last visited July 10, 2024.
↩ -
See, e.g., Instant, Your All-in-One Employee Pay Platform, https://www.instant.co/ and DailyPay, EWA Platform, https://www.dailypay.com/earned-wage-access-platform/ . All websites last visited July 10, 2024.
↩ -
See, e.g., Brigit, Our Pricing, https://www.hellobrigit.com/pricing ; Dave, Free yourself from hidden fees, https://dave.com/no-hidden-fees . All websites last visited July 10, 2024.
↩ -
California Department of Financial Protection and Innovation, 2021 Earned Wage Access Findings, (March 2023), https://dfpi.ca.gov/wp-content/uploads/sites/337/2023/03/2021-Earned-Wage-Access-Data-Findings-Cited-in-ISOR.pdf (hereinafter DFPI Findings); See also, CFPB, Comment on Proposed Rule Addressing “Income-Based Advances” and Related Charges (November 2023), https://files.consumerfinance.gov/f/documents/cfpb_comment-letter-to-dfpi-2023-11.pdf
↩ -
DFPI Findings, pg. 61-62; Lux & Chung; Center for Responsible Lending, Paying to be Paid: Consumer Protections Needed for Earned Wage Advances and Other Fintech Cash Advances (Oct 2023), available at https://www.responsiblelending.org/sites/default/files/nodes/files/research-publication/crl-ewa-brief-oct2023.pdf ; National Consumer Law Center, Earned Wage Advances and Other Fintech Payday Loans: Workers Shouldn’t Pay to be Paid (Apr 2023), https://www.nclc.org/wp-content/uploads/2023/03/IB_Earned_Wage_Advances-3-3-23-1-1.pdf ; Financial Health Network, Exploring Earned Wage Access as a Liquidity Solution (Nov 2023), available at https://finhealthnetwork.org/wp-content/uploads/2023/12/EWA-Users-Report-2023.pdf (funded by an employer-partnered firm).
↩ -
See GAO, “Financial Technology: Products Have Benefits and Risks to Underserved Consumers, and Regulatory Clarity is Needed” (Mar 2023), available at pg. 21, https://www.gao.gov/assets/gao-23-105536.pdf .
↩ -
Some providers charge fees for both the cost of the transaction and to transfer funds from a provider’s debit card to a user’s personal account. Figure 2 is not exhaustive of all firms, products, and fees.
↩ -
See AnyDay, https://anydayispayday.com/frequently-asked-questions/ ; Branch, https://www.branchapp.com/legal/terms ; DailyPay, https://get.dailypay.com/our-fees/ ; Immediate, https://joinimmediate.com/ewa-therightway/ ; OrbisPay, https://www.orbispay.me/terms-of-service ; Rain, https://www.rainapp.com/terms/eft ; Brigit, https://www.hellobrigit.com/pricing ; Dave, https://dave.com/no-hidden-fees . All websites last visited July 10, 2024.
↩ -
Utilizing aggregated transaction volume and fee pricing data for the companies in our sample that collect consumer fees, we estimate the percent of transactions which incurred a fee and the average size of each fee. For firms that offer a range of pricing options, we use a midpoint between the highest and lowest fees collected to construct our estimate. We exclude from this analysis one provider which reported that over 95% of fees are subsidized by employer partners and another firm that declined to provide fee data.
↩ -
There is an exception of one provider which reported that over 95% of all fees are subsidized by employer partners.
↩ -
See note 20.
↩ -
One firm declined to provide information regarding fees paid for instant transfers to an external account. Another firm reported that a large percentage of their fee revenue was subsidized by employers. Figures 3-4 do not include any data from those firms. In addition, these metrics do not include revenue from employer subsidization and interchange fees.
↩ -
See note 20.
↩ -
California reported a 331% APR for two “non-tip” companies (firms that do not solicit tips) based on transaction and quarterly data for two quarters of 2021, weighted by the number of transactions. DFPI Findings at pg. 3 & 7. Non-tip companies may include both employer-partnered and direct-to-consumer firms. Our sample does not include transaction level data.
↩ -
When combining all earned wage product revenue, including expedited transfer fees and tips, Dave earns approximately $8 per transaction and has an average transaction amount of $144 for seven to ten days (see https://investors.dave.com/node/8116/html ).
↩ -
Parrish 2021, pg. 10-11.
↩ -
The direct-to-consumer charge-off rate is an average of two large direct-to-consumer companies that file public financial information. Other similar companies may have higher or lower charge-off rates, and these rates tend to vary year-to-year. See https://investors.moneylion.com/filings-financials/sec-filings/annual-reports/content/0000950170-23-008455/ml-20221231.htm ; https://investors.dave.com/node/8116/html .
↩ -
Lux & Chung. In this survey of 1000 earned wage users, the majority fell under federal poverty guidelines and over 80% were hourly or gig workers. Of survey participants, 41% reported having access to employer-partnered products and over 60% had used a direct-to-consumer app. The survey noted that “…many users had complaints about high fees, overdrafts caused by [direct-to-consumer] apps, and getting caught in a liquidity cycle,” see pg. 20. The survey did not distinguish between users of the two earned wage product models.
↩