Cash-back Fees
Executive Summary
Access to cash is a necessary component of a resilient financial system and dynamic economy. Many people rely on cash for day-to-day transactions due its privacy and reliability, and cash accessibility is particularly critical in the case of a disruption or outage of digital payment systems. While people use various means of getting cash, one common method is to get “cash back” at a store when making a purchase with a debit or prepaid card. This option may be particularly important in banking deserts and in areas where banks and ATM operators charge significant fees. Retailers are essentially filling a void in access to cash, which has historically been supplied by banks and credit unions in an affordable way.
Providing cash back is valuable to consumers and merchants. Survey data show that it is a popular method to get money via consumers’ bank debit or prepaid cards. Merchants offer cash back to attract customers and reduce their cash handling costs. In its recent engagement and market monitoring, the CFPB observed that some retailers charge a fee for this transaction.
This spotlight provides an overview of consumers’ use of cash back, the benefits and costs of such transactions to merchants, and the practices of other market actors which do not charge fees for this service. The CFPB also analyzed the cash-back fees of a sample of national retailers.
Fees for cash back may serve as a barrier and reduce people’s access to cash when they need it. The CFPB will continue to monitor developments related to the fees consumers pay for accessing cash, and the underlying failure of banks and credit unions to adequately supply cash throughout the country in an affordable manner.
Key Findings
- Cash-back fees are costing consumers millions of dollars. The CFPB found that three companies in the sample charge cash-back fees and estimates that they collect over $90 million in fees annually for people to access their cash. The CFPB also estimates that the marginal cost to merchants for processing each transaction may be a few pennies, compared to the much higher fees charged by these retailers to consumers. While there may be other costs related to cash handling, these are generally reduced by the provision of cash back, as it reduces merchants’ cash on hand.
- Three major firms charge cash-back fees even though other competitors offer it for free. Three retail companies Dollar General, Dollar Tree, and Kroger, which also operate brands such as Family Dollar, Harris Teeter, Ralph’s, and others, charge fees for this service while other national retail companies sampled by the CFPB do not charge a fee. At the two largest dollar store corporations, cash-back fees for small withdrawal amounts are the highest in the sample ($1 or more for amounts under $50). Kroger, the country’s largest grocery chain, recently expanded cash-back fees to its Harris Teeter brand (75 cents for $100 or less), higher than those in place among its other brands (50 cents for $100 or less), in addition to higher fees for larger amounts.
- Cash-back fees are levied on low pre-set cash withdrawal amounts. Many merchants pre-determine the withdrawal amount options in a single transaction, commonly between $5 and $50. The fees charged on small, constrained amounts often constitute a high percentage of the cash withdrawal and limit consumers’ ability to spread the cost of that fee over larger amounts. It may also induce repeat withdrawals, with consumers incurring a new fee each time.
- Consumers with lower incomes or fewer banking choices may be more likely to encounter cash-back fees. Dollar stores are frequently located in small rural towns, communities of color, and low-income communities. These areas are also more likely to be places where there are fewer branch locations, and communities where people are more reliant on cash for daily transactions than others.
Cash-back Transactions
This section summarizes the importance of cash availability and the use of cash-back as an access point for consumers.
Cash is a critical part of a resilient payment ecosystem. Surveys show people still try to have cash on hand1 and nearly 90 percent of people used cash in the last 30 days.2 Cash accessibility is necessary should other types of digital payment systems experience failures,3 such as in the event of a natural disaster or some other catastrophe,4 or a technological malfunction at a single company.5 Additionally, some populations are more reliant on cash than others for day-to-day transactions. For example, cash is more frequently used by people with lower incomes, racial minorities, and older Americans than other populations.6 As discussed below, cash back is a common method for obtaining cash for many consumers.
How cash back works
Consumers may obtain cash during the completion of a purchase transaction at certain stores when using a PIN-authenticated debit card or prepaid card at the register. Some merchants also provide cash back at self-service registers. Consumers typically must choose from pre-set withdrawal amount options presented at the payment terminal at the time of the transaction. In a cash-back transaction, consumers are usually limited to a maximum withdrawal amount ranging from $5 to $50, though some merchants may allow higher amounts.
Scope of usage
CFPB analysis of data from the Diary and Survey of Consumer Payment Choice (Survey) found that from 2017 to 2022, cash withdrawals at retail locations made up 17 percent of all transactions by which people got cash from their checking account, savings account, or prepaid card. As shown in Figure 1, cash withdrawals at retail are second only to ATMs (61%) and more frequently used than bank tellers (14%). The Survey and methodology are discussed in the Tables and Notes section.
Figure 1: Instances of getting cash from bank account or prepaid card, by location, 2017 to 2022, combined
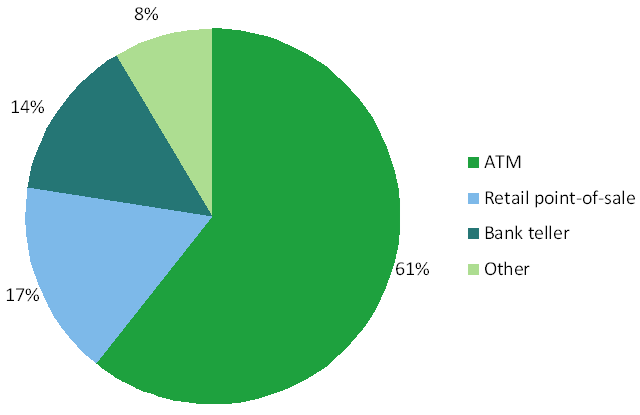
Source: CFPB tabulations of the Diary and Survey of Consumer Payment Choice.
The Survey data also show that from 2017 to 2022, cash withdrawals at a retail location (restricted to those where the source of funds was the consumer’s checking, savings, or a prepaid card) had a mean withdrawal amount of $34 (median: $20).7 By contrast, during this same timeframe, the mean ATM withdrawal among survey participants was $126 (median: $100).8 A study by researchers at the Federal Reserve Bank of Atlanta utilizing Survey data found that cash withdrawals at a retail store had the lowest average amount of cash withdrawal, and noted that “[t]he amount of cash received at a retail store is constrained by the store’s limits, so the amount of cash received in this way is not necessarily at the discretion of the consumer.”9
Cash back may serve as a particularly important point of access in the absence of other banking services. A 2014 study by the Federal Reserve Bank of Richmond analyzed cash-back transactions from a national discount retail chain from 2010 to 2012.10 Looking specifically at the Richmond bank’s district, the area with the highest frequency of cash-back transactions was in the southeastern region of South Carolina, an area “that has been subject to ‘persistent poverty’” and “has some of the sparsest dispersion of bank branches.”11 The study also illustrated the lucrative nature of cash-back fees: During the course of this study period, the merchant introduced a fee for cash back. Data from this report indicates that the retailer collected approximately $21 million in cash-back fees in a year.12
Benefits and Costs to Merchants
Merchants benefit from offering cash back at point-of-sale. First, the service may attract potential shoppers, either people making a purchase in order to get cash back or people who prefer one retail location over another in order to conveniently combine tasks. Second, it reduces merchants’ cash handling costs.13 Dispensing cash to consumers, such as through cash-back transactions, reduces merchants’ supply of cash and therefore also reduces their cost of handling, transporting, and depositing excess cash.
Merchants incur costs for processing any type of payment transaction, including cash-back transactions. On any purchase using an electronic payment method, including a PIN-authorized debit-card or prepaid card, a merchant will incur a range of fees for processing that payment, such as interchange, network, and processing fees. While the merchant incurs these fees for a consumer’s purchase, there is an additional cost for providing cash back to the consumer.
To assess this additional transaction cost to the merchant for providing cash back, the CFPB modeled potential scenarios based on publicly available data and our market monitoring activities. The model incorporates estimates of merchant-incurred fees, such as interchange, network, processing, and fraud control fees. Methodology is discussed in detail in the Table and Figure Notes. The CFPB estimates that the additional marginal transactional cost to a merchant for processing a typical cash-back debit card transaction may range from a penny to about 20 cents (Table 1).
Table 1: Estimated additional merchant cost of a debit card cash-back transaction
| Example Retailer | Purchase Amount | Merchant Transaction Cost for Purchase Only | Additional Merchant Cost for $10 Cash Back | Additional Merchant Cost for $40 Cash Back |
|---|---|---|---|---|
National Discount Chain |
$20 |
$0.33 |
$0.05 |
$0.19 |
National Grocery Store |
$20 |
$0.33 |
$0.01 |
$0.02 |
Source: CFPB calculations based on public data about industry practices and averages. See Table and Figure Notes below for methodology.
Cash-back Fees
This section provides an analysis of cash-back fee practices of eight national retail chains. It includes a discussion of the variation of these practices among these national chains and other actors, such as local independent grocers. The analysis is supplemented by market monitoring discussions with merchants about fees, costs, and consumer trends, both among merchants who charge cash back fees and those who do not. The CFPB also conducted consumer experience interviews and reviewed consumer complaints submitted to the CFPB. It concludes with a discussion of how these fees appear to function differently than fees for cash withdrawals at ATMs.
Current market practices
As of August 2024, there is no publicly available survey data regarding merchants’ cash-back practices or fees. To establish a baseline, the CFPB documented the fee practices of eight large retail companies. The sample consists of the two largest retail actors, measured by number of locations, across four different sectors: Dollar Stores, Grocery Stores, Drugstores, and Discount Retailers.14 Using this approach, the eight retailers sampled are: Dollar General and Dollar Tree Inc. (Dollar Stores), Kroger Co. and Albertsons Companies (Grocery Stores), Walgreens and CVS (Drugstores), and Walmart and Target (Discount Retailers).
All retailers in our sample offer cash-back services, but only Dollar General, Dollar Tree Inc., and Kroger Co. brands charge a fee. Other retailers offer cash-back for free, even for withdrawal amounts similar to or larger than those provided by the three retailers who charge. (Table 2). Among the national chains that charge these cash-back fees, the CFPB estimates that they collect over $90 million in fees annually for people to access their cash.15
Table 2: Cash-back fee practices, major retail companies
| Company | U.S. Stores | Fee for Cash Back | Maximum Withdrawal Amount (Per Transaction) |
|---|---|---|---|
Dollar General |
20,022 |
$1 to $2.50, depending on amount and other variables |
$40 |
Dollar Tree Inc. |
16,278 |
Family Dollar: $1.50 |
$50 |
Kroger Co. |
2,722 |
Harris Teeter brand: |
Harris Teeter brand: $200 |
Albertsons Brand |
2,271 |
No |
$200 |
Walmart |
5,214 |
No |
$100 |
Target |
1,956 |
No |
$40 |
Walgreens |
8,600 |
No |
$20 |
CVS |
7,500 |
No |
$60 |
Source: CFPB analysis of the retail cash-back market. See Table and Figure Notes for methodology.
Beyond these national chains, there are other providers offering cash back as a free service to their customers. Through its market monitoring activities, the CFPB observed that many local independent grocers offer the service, but do not charge a fee. They do not charge a fee even though they are likely to have thinner profit margins and less bargaining power than national chains to negotiate on pricing on costs they incur from wholesalers or fees for payment processors. The U.S. Postal Service also offers cash back on debit transactions, in increments of $10 up to a $50 maximum, free of charge.16
Cash-back fees at dollar stores
Among the merchants sampled, Dollar General and Dollar Tree Inc. charge the highest fees for withdrawal amounts under $50. These fees combined with the constrained withdrawal amount may mean that the fee takes up a hefty percentage relative to the amount of cash withdrawn, and people may be less able to limit the impact of the fee by taking out more cash.
Additionally, the geographic distribution of dollar store chains and their primary consumer base raises concerns that these fees may be borne by economically vulnerable populations and those with limited banking access. Dollar stores are prevalent in rural communities, low-income communities, and communities of color – the same communities who may also face challenges in accessing banking services. 17 For example, Dollar General noted that in 2023 “approximately 80% of [its] stores are located in towns of 20,000 or fewer people,”18 while Dollar Tree Inc. operated at least 810 dual-brand combination stores (Family Dollar and Dollar Tree in a single building) designed specifically “for small towns and rural communities…with populations of 3,000 to 4,000 residents.”19
Though they are open to and serve consumers of all income levels, dollar stores report that they locate stores specifically to serve their core customers: lower-income consumers.20 In urban communities, one study shows, “proximity to dollar stores is highly associated with neighborhoods of color even when controlling for other factors.”21 These same communities may also face challenges in accessing banking services. Low-income communities and communities of color often face barriers to access to banking services, and rural communities are 10 times more likely to meet the definition of a banking desert than urban areas.22
Though the dollar store concept existed as far back as the 1950s, it has experienced significant expansion and consolidation since the 2000s.23 Dollar Tree Inc. acquired Family Dollar in 2015.24 From 2018 to 2021, nearly half of all retail locations opened in the U.S. were dollar stores.25 In research examining the impact of dollar store expansion, studies indicate that the opening of a dollar store is associated with the closure of nearby local grocery retailers.26
Variation of fees charged
In its scan of current market practices, the CFPB found variations in fee charges among store locations and brands owned by the same company. For example, as reflected in Table 2, Dollar Tree charges consumers $1 for cash back at Dollar Tree branded stores, but $1.50 in its Family Dollar stores. Similarly, Kroger Co. has two different fee tiers for its brands. In 2019, Kroger Co. rolled out a $0.50 cash-back fee for amounts of $100 or less, and $3.50 for amounts between $100 and $300. This took effect at brands such as Kroger, Fred Meyers, Ralph’s, QFC, Pick ‘N Save, and others. At the time of the rollout, the company noted two exceptions: Electronic benefits transfer (EBT) card users would not be charged a fee, and customers using their Kroger Plus card would not be charged for amounts under $100 but would be charged $0.50 for larger amounts. Kroger Co. acquired the southern grocery chain Harris Teeter in 2014, but it did not begin charging a cash-back fee at those stores until January 2024, at $0.75 for amounts of $100 or less, and $3 for larger amounts.27
In its engagement with stakeholders, the CFPB learned that Dollar General’s fees appeared to vary in different locations. To better understand this potential variation, in December 2022, the CFPB mystery shopped at nine locations in one state, across a mix of rural, suburban, and urban communities. The CFPB acknowledges this is a small sample and is not intended to be representative. The data collected is based on the knowledge of the store associates at the time of each interaction.
In these findings, the CFPB learned of a range of fee variations across store locations: five of the nine respondents noted that the fee varies depending on the type of card used for the transaction. When probed for the meaning of “type of card,” most noted that it is dependent on the customer’s bank, though it is not exactly clear what fees will be triggered by what card type prior to initiating the transaction. Additionally, reported fees range from $1 to $2.50, with some stores reporting a flat fee structure of $1.50 and others reporting a range that tiered up with larger withdrawal amounts (with a cap of withdrawal amounts at $40). Most stores in this sample had a range of fees between $1.00 and $1.50, although two stores located in small, completely rural counties had a higher range of fees. The store located in the smallest and most isolated county within the sample, with only about 3,600 people, had the highest reported fee amount of $2.50.
Distinction from ATM fees
One of the market dynamics likely contributing to retailers’ ability to charge these fees is the high fees also charged to consumers for using out-of-network automated teller machines (ATMs). One source estimates that the average out-of-network ATM fee is $4.77, accounting for both the surcharge fee charged by the ATM owner and the foreign fee charged by the consumer’s financial institution.28 By comparison, a $2 fee for cash back at a retailer may appear cheaper, and usually does not trigger an additional fee by the consumers’ financial institution or prepaid card issuer. Notwithstanding the high ATM fees, there are reasons for focused attention on the consumer risk of cash-back fees charged by retailers, primarily the amount of the fee relative to the value of the cash withdrawal and the distribution of the fee burden across income groups.
In a typical ATM transaction, a consumer has a greater ability to distribute the cost of the fee across a larger amount of cash than with cash back. There may be some exceptions to this for consumers who have only $10 or $20 in their bank account, but as shown in Table 3, low-income consumers and others withdraw greater amounts at ATMs than via cash-back, on average. In cash-back transactions, lower withdrawal limits are in place, and consumers do not have that option to withdraw larger amounts. CFPB analysis of the Diary and Survey of Consumer Payment Choice from 2017 to 2022 show that even among consumers with incomes below $50,000, the amount withdrawn at an ATM is more than double the typical cash-back withdrawal amount. Additionally, for the average and median amounts, across all incomes the ATM withdrawal amounts are larger than cash-back withdrawal amounts. (Table 3).
Table 3: Average ATM and cash-back withdrawal amounts, by income, 2017 to 2022 combined
| Income | Average ATM Withdrawal | Average Cash-back Withdrawal | Median ATM Withdrawal | Median Cash-back Withdrawal |
|---|---|---|---|---|
Less than $25,000 |
$144 |
$45 |
$65 |
$20 |
$25,000 to $49,999 |
$113 |
$35 |
$60 |
$25 |
$50,000 to $74,999 |
$113 |
$29 |
$84 |
$20 |
$75,000 to $99,000 |
$114 |
$45 |
$100 |
$26 |
$100,000 or more |
$146 |
$33 |
$100 |
$20 |
All |
$128 |
$35 |
$100 |
$20 |
Source: CFPB tabulations of the Diary and Survey of Consumer Payment Choice. See Table and Figure Notes for methodology.
Further, while merchants limit the amount of a single withdrawal, there is no limit on the number of withdrawals. So, if a consumer needs $100 cash at a store which limits a single withdrawal to a maximum amount of $50 with a $2 fee, the consumer would have to make two $50 withdrawals for a $4 fee plus the cost of any otherwise unwanted purchase required to access the cash-back service.
Finally, the burden of cash-back fees may be distributed differently than ATM fee burdens. The share of borrowers who pay ATM fees for cash withdrawals is relatively evenly distributed across income levels, according to a study based on the Diary and Survey of Consumer Payment Choice.29 The study found little variation in the percentage of consumers who encountered a fee for an ATM cash withdrawal by income quintile, though the study did not look at the amount of the ATM fees paid. Analogous data are not available for cash-back fees, but a similarly even distribution across incomes is unlikely given the demographics of the consumer base served by the largest retailers which charge fees (dollar stores).
Conclusion
While the use of digital payment methods is on the rise, cash accessibility remains a critical component of a resilient financial infrastructure and dynamic economy. Bank mergers, branch closures, and bank fee creep have reduced the supply of free cash access points for consumers. In this void, people may be more reliant on retailers for certain financial services historically provided by banks and credit unions, such as cash access. In this context, we observe that some retailers provide cash back as a helpful service to their customers, while other retailers may be exploiting these conditions by charging fees to their consumers for accessing their cash.
This spotlight examines the presence of retailer cash-back fees and impact to consumers. Cash-back fees are being levied by just a small handful of large retail conglomerates (Dollar General, Dollar Tree Inc., and Kroger Co.) amidst a backdrop of consolidation in these segments. Meanwhile, other larger retailers continue to offer cash-back services free. The CFPB estimates cash-back fees cost consumers about $90 million a year.
The CFPB is concerned that reduced access to cash undermines the resilience of the financial system and deprives consumers of a free, reliable, and private means of engaging in day-to-day transactions. The CFPB will continue to monitor developments related to the fees consumers pay for accessing cash, and work with agencies across the federal government to ensure people have fair and meaningful access to the money that underpins our economy.
Table and Figure Notes
Notes for Figure 1
The Federal Reserve Bank of Atlanta’s annual Diary and Survey of Consumer Payment Choice (Survey) tracks consumers’ self-reported payment habits over a three-day period in October using a nationally representative sample. The survey includes a question about whether and how consumers access cash, such as where they made the withdrawal, the source of the cash, and the amount of the withdrawal. Figure 1 provides a percentage of all cash-back withdrawal transactions from a bank account, checking account, or prepaid card reported between 2017 and 2022, by location (ATM, Retail point-of-sale, Bank teller, and Other). The number of observations during this time is 192 transactions. It does not include cash-back transactions made using a credit card cash advance feature or other form of credit.
Notes for Table 1
This model assumes that 80 percent of the merchant transaction cost is due to interchange fees, 15 percent due to network fees, and 5 percent due to payment acquirer fees. It also includes a $0.01 fee for fraud protection. For regulated transactions, the interchange fees are $0.22 + 0.05% of the transaction amount. Regulated transactions are those where the debit card used is issued by a bank with more than $10 billion in assets, and subject to 15 U.S.C. § 1693o-2. Exempt transactions are those not subject to this statutory cap on interchange fees. While Mastercard does not publish its fees for exempt transactions, Visa does. This model uses Visa’s published fees as of October 2023 for card-present transactions: for the National Discount Chain, the fees for Exempt Retail Debit ($0.15 + 0.80%), and for the National Grocery Chain, Exempt Supermarket Debit ($0.30 flat fee). An October 2023 Federal Reserve report on interchange fee revenue found that in 2021, the most recent data available, 56.21 percent of debit transactions were regulated and 43.79 percent were exempt. This composition is reflected in the table.
Notes for Table 2
The storefront counts for each of the retailers come from their websites, last visited on March 28, 2024, or their most recent reports to investors. Fee information was gathered either through publicly available information such as the merchant’s website, and/or verified through the CFPB’s market monitoring activities.
Dollar Tree Inc. announced on March 13, 2024 that it will close 1,000 of its Family Dollar and Dollar Tree brands stores over the course of the year. If those closures occur, Dollar Tree, Inc. will still have over 15,000 storefronts across the country.
In October 2022, Kroger Co. and Albertsons Companies announced their proposal to merge, though on February 26, 2024, the Federal Trade Commission and nine state attorneys general sued to block this proposal, alleging that the deal is anti-competitive. On April 22, 2024, Kroger Co. and Albertsons Companies announced a revised plan in which, if the merger is approved, the combined entity would divest 579 stores to C&S Wholesalers. If the divestiture occurs, the combined entity will still have over 4,400 stores across the country.
Notes for Table 3
See above notes for Figure 1 about the Diary and Survey of Consumer Payment Choice (Survey). Table 3 provides mean and median amounts of ATM and Retail point-of-sale cash withdrawal transactions by income. In the Survey, participants were asked to report the total combined income of all family members over age 15 living in the household during the past 12 months. From these responses, we constructed five income brackets – four of $25,000 each plus a fifth bin for any respondents reporting more than $100,000 in annual household income for each respondent in each year.
Endnotes
-
See e.g., Jay Lindsay, A Fatal Cash Crash? Conditions Were Ripe for It After the Pandemic Hit, but It Didn’t Happen, Fed. Rsrv. Bank of Boston (Nov. 2, 2023), https://www.bostonfed.org/news-and-events/news/2023/11/cash-crash-pandemic-increasing-credit-card-use-diary-of-consumer-payment-choice.aspx
↩ -
Kevin Foster, Claire Greene, & Joanna Stavins, The 2023 Survey and Diary of Consumer Payment Choice, Fed. Rsrv Bank of Atlanta (June 2024), https://doi.org/10.29338/rdr2024-01
↩ -
See e.g., Hilary Allen, Payments Failure, Boston College Law Review, Forthcoming, American University, WCL Research Paper No. 2021- 11, (Feb. 21, 2020) available at https://papers.ssrn.com/sol3/papers.cfm?abstract_id=3539797
↩ -
See e.g., Scarlett Heinbuch, Cash Is Critical in Times of Crisis, Fed. Rsrv. Bank of Atlanta (Mar. 7, 2022), https://www.atlantafed.org/blogs/take-on-payments/2022/03/07/cash-in-crisis
↩ -
See e.g., Carly Page, Square Says It Has Resolved Daylong Outage, TechCrunch, (Sept. 8, 2023), https://techcrunch.com/2023/09/08/square-day-long-outage-resolved/ . See also Caroline Haskins, The Global CrowdStrike Outage Triggered a Surprise Return to Cash, Wired, (July 19, 2024), https://www.wired.com/story/microsoft-crowdstrike-outage-cash/ .
↩ -
See Berhan Bayeh, Emily Cubides and Shaun O’Brien, 2024 Findings from the Diary of Consumer Payment Choice, Fed. Rsrv. (May 13, 2024), https://www.frbservices.org/binaries/content/assets/crsocms/news/research/2024-diary-of-consumer-payment-choice.pdf (findings related to low-income consumers and older Americans use of cash); Emily Cubides and Shaun O’Brian, 2023 Findings from the Diary of Consumer Payment Choice, Fed. Rsrv., (May 19, 2024), https://www.frbsf.org/cash/wp-content/uploads/sites/7/2023-Findings-from-the-Diary-of-Consumer-Payment-Choice.pdf (findings related to unbanked households use of cash), and Michelle Faviero, , More Americans are Joining the ‘Cashless’ Economy,” Pew Rsch. Ctr, (Oct. 5, 2022), https://www.pewresearch.org/short-reads/2022/10/05/more-americans-are-joining-the-cashless-economy/ (findings related to use of cash by race and other demographics).
↩ -
Similarly, the average cash-back withdrawal amount was $33 in 2012, the most recent data available from the Federal Reserve Payments Study. The study was based on self-reported information from financial institutions surveyed by the Federal Reserve. Of the reported transactions, 73 percent were debit cards with an average amount of $33 and 27 percent on general purpose prepaid cards with an average withdrawal amount of $19. 2013 Federal Reserve Payments Study: Recent and Long-Term Payment Trends in the United States: 2003 – 2012, Fed. Rsrv. Bd. (July 2014), https://www.frbservices.org/binaries/content/assets/crsocms/news/research/2013-fed-res-paymt-study-summary-rpt.pdf
↩ -
The amounts in the Survey are lower than the average ATM withdrawal amounts reported in 2022 Federal Reserve Payments study, which utilizes data from surveying financial institutions. Per this study, in 2021, the average ATM withdrawal was $198. The Federal Reserve Payments Study: 2022 Triennial Initial Data Release, Fed. Rsrv. Bd. (Apr. 21, 2023), https://www.federalreserve.gov/paymentsystems/fr-payments-study.htm
↩ -
Claire Green and Oz Shy, How Consumers Get Cash: Evidence from a Diary Survey, Fed. Rsrv. Bank of Atlanta, (Apr. 2019), at 5, https://www.atlantafed.org/-/media/documents/banking/consumer-payments/research-data-reports/2019/05/08/how-consumers-get-cash-evidence-from-a-diary-survey/rdr1901.pdf (finding, “For the largest amounts of cash, respondents mostly turned to employers, with an average dollar value of cash received of $227. At bank tellers and ATMs, consumers also received average dollar values greater than the overall average: $159 and $137, respectively. Consumers received smaller amounts from family or friends ($93) and, notably, cash back at a retail store ($34). All these dollar amounts are weighted. The amount of cash received at a retail store is constrained by the store’s limits, so the amount of cash received in this way is not necessarily at the discretion of the consumer.”)
↩ -
Neil Mitchell and Ann Ramage, The Second Participant in the Consumer to Business Payments Study, Fed. Rsrv. Bank of Richmond (Sept. 15, 2014), https://www.richmondfed.org/~/media/richmondfedorg/banking/payments_services/understanding_payments/pdf/psg_ck_20141118.pdf
↩ -
Id. at 8.
↩ -
Id. at 8, Figures 7 and 8.
↩ -
See e.g., Stan Sienkiewicz, The Evolution of EFT Networks from ATMs to New On-Line Debit Payment Products, Discussion Paper, Payment Cards Ctr. of the Fed. Rsrv. Bank of Philadelphia (Apr. 2002), https://www.philadelphiafed.org/-/media/frbp/assets/consumer-finance/discussion-papers/eftnetworks_042002.pdf?la=en&hash=88302801FC98A898AB167AC2F9131CE1 (“The cash back option became popular with supermarket retailers, since store owners recognized savings as a result of less cash to count at the end of the day, a chore that represented a carrying cost to the establishment.”).
↩ -
These market segments and retailers for purposes of markets analysis are similar to those used in other academic literature related to dollar store locations in the context of food access or impact on other market dynamics, such as on local grocers. See e.g., El Hadi Caoui, Brett Hollenbeck, and Matthew Osbourne, The Impact of Dollar Store Expansion on Local Market Structure and Food Access,” (June 22, 2022), available at https://ssrn.com/abstract=4163102 (finding "In 2021, there were more of these stores operating than all the Walmarts, CVS, Walgreens, and Targets combined by a large margin.”) and Yue Cao, The Welfare Impact of Dollar Stores,” available at https://yuecao.dev/assets/pdf/YueCaoDollarStore.pdf (last visited Aug. 23, 2024) (using the categories of dollar stores, groceries, and mass merchandise (such as Walmart) for comparisons across retail segments and noting that dollar stores regard these other segments as competitors).
↩ -
Estimate based on information voluntarily provided in the CFPB's market monitoring activities.
↩ -
What Forms of Payment are Accepted? U.S. Postal Serv., https://faq.usps.com/s/article/What-Forms-of-Payment-are-Accepted (last visited Aug. 23, 2024).
↩ -
See generally, Stacy Mitchell, Kennedy Smith, and Susan Holmberg , The Dollar Store Invasion, Inst. for Local Self Reliance (Mar. 2023), https://cdn.ilsr.org/wp-content/uploads/2023/01/ILSR-Report-The-Dollar-Store-Invasion-2023.pdf . There is also extensive research on dollar store locations in other contexts such as food access and impact on consumer spending habits. El Hadi Caoui, Brett Hollenbeck, and Matthew Osbourne, The Impact of Dollar Store Expansion on Local Market Structure and Food Access,” at 5, (June 22, 2022), available at https://ssrn.com/abstract=4163102
↩ -
Dollar General Annual Report (Form10-K) at 7 (Mar. 25. 2024), https://investor.dollargeneral.com/websites/dollargeneral/English/310010/us-sec-filing.html?format=convpdf&secFilingId=003b8c70-dfa4-4f21-bfe7-40e6d8b26f63&shortDesc=Annual%20Report .
↩ -
Dollar Tree, Inc. Annual Report (Form 10-K) at 7 (Mar. 20. 2024), https://corporate.dollartree.com/investors/sec-filings/content/0000935703-23-000016/0000935703-23-000016.pdf
↩ -
See e.g., Dollar General Annual Report (Form10-K) at 7 (Mar. 25. 2024) (“We generally locate our stores and plan our merchandise selections to best serve the needs of our core customers, the low and fixed income households often underserved by other retailers, and we are focused on helping them make the most of their spending dollar.” And, Dollar Tree, Inc. Annual Report (Form 10-K) at 6 (Mar. 20. 2024), (“Family Dollar primarily serves a lower than average income customer in urban and rural locations, offering great values on everyday items.”)
↩ -
Dr. Jerry Shannon, Dollar Stores, Retailer Redlining, and the Metropolitan Geographies of Precarious Consumption, Ann. of the Am. Assoc. of Geographers, Vol. 111, No. 4, 1200-1218 (2021), (analyzing over 29,000 storefront locations of Dollar General, Dollar Tree, and Family Dollar locations across the three largest MSA in each of the nine U.S. Census Bureau-defined divisions.)
↩ -
Kristen Broady, Mac McComas, and Amine Ouazad, An Analysis of Financial Institutions in Black-Majority Communities: Black Borrowers and Depositors Face Considerable Challenges in Accessing Banking Services,” Brookings Inst., (Nov. 2, 2021), https://www.brookings.edu/articles/an-analysis-of-financial-institutions-in-black-majority-communities-black-borrowers-and-depositors-face-considerable-challenges-in-accessing-banking-services/ and Drew Dahl and Michelle Franke, Banking Deserts Become a Concern as Branches Dry Up, Fed. Rsrv. Bank of St. Louis, https://www.stlouisfed.org/publications/regional-economist/second-quarter-2017/banking-deserts-become-a-concern-as-branches-dry-up (July 25, 2017).
↩ -
El Hadi Caoui, Brett Hollenbeck, and Matthew Osbourne, The Impact of Dollar Store Expansion on Local Market Structure and Food Access,” (June 22, 2022), available at https://ssrn.com/abstract=4163102 .
↩ -
Dollar Tree Completes Acquisition of Family Dollar, Dollar Tree Inc., (July 6, 2015), available at https://corporate.dollartree.com/news-media/press-releases/detail/120/dollar-tree-completes-acquisition-of-family-dollar
↩ -
El Hadi Caoui, Brett Hollenbeck, and Matthew Osbourne, The Impact of Dollar Store Expansion on Local Market Structure and Food Access,” (June 22, 2022), available at https://ssrn.com/abstract=4163102 and Yue Cao, The Welfare Impact of Dollar Stores, https://yuecao.dev/assets/pdf/YueCaoDollarStore.pdf (last visited Aug. 23. 2024).
↩ -
Id.
↩ -
Evan Moore, Harris Teeter Introduces New Fees that Have Customers Upset. What To Know Before You’re Charged, Charlotte Observer, (Mar. 14, 2024), https://amp.charlotteobserver.com/news/business/article286627340.html
↩ -
Karen Bennett and Matthew Goldberg, Survey: ATM fees Reach 26-year High While Overdraft Fees Inch Back Up, Bankrate.com (Aug. 21, 2024), https://www.bankrate.com/banking/checking/checking-account-survey/
↩ -
Oz Shy and Joanna Stavins, Who Is Paying All These Fees? An Empirical Analysis of Bank Account and Credit Card Fees, Fed. Rsrv. Bank of Boston, Working Paper No. 22-18, at Table 2, (Aug. 2022), https://www.bostonfed.org/publications/research-department-working-paper/2022/who-is-paying-all-these-fees-an-empirical-analysis-of-bank-account-and-credit-card-fees .
↩